Microsoft PowerPoint - SmartArt
Course - PowerPoint Advance
Published on 5 Dec 2020 at 04:67

SmartArt –
Well it’s a time to add some graphics in your presentation, which makes your document more attractive and interactive while reading.
SmartArt is again a very nice tool, which allow you to speak by use graphics instead of text to communicate with your audience more effectively. So it’s a good tool which make you presentation friendly to viewer.
How to insert SmartArt?
Well you ask a valid question, and in a next paragraph you will get a steps to insert it in your slide. So follow these simple steps and learn to speak in a language of graphics.
- First select the slide, and place your cursor where you want to add a graphics.
- Second, under an Insert menu you will see a SmartArt command.
- On clicking on it, a new dialog box will appear.
- On left side you will see a category, select any one of your choice.
- Click OK, and it’s appear in your document.
- Now simply edit it as per your desire.
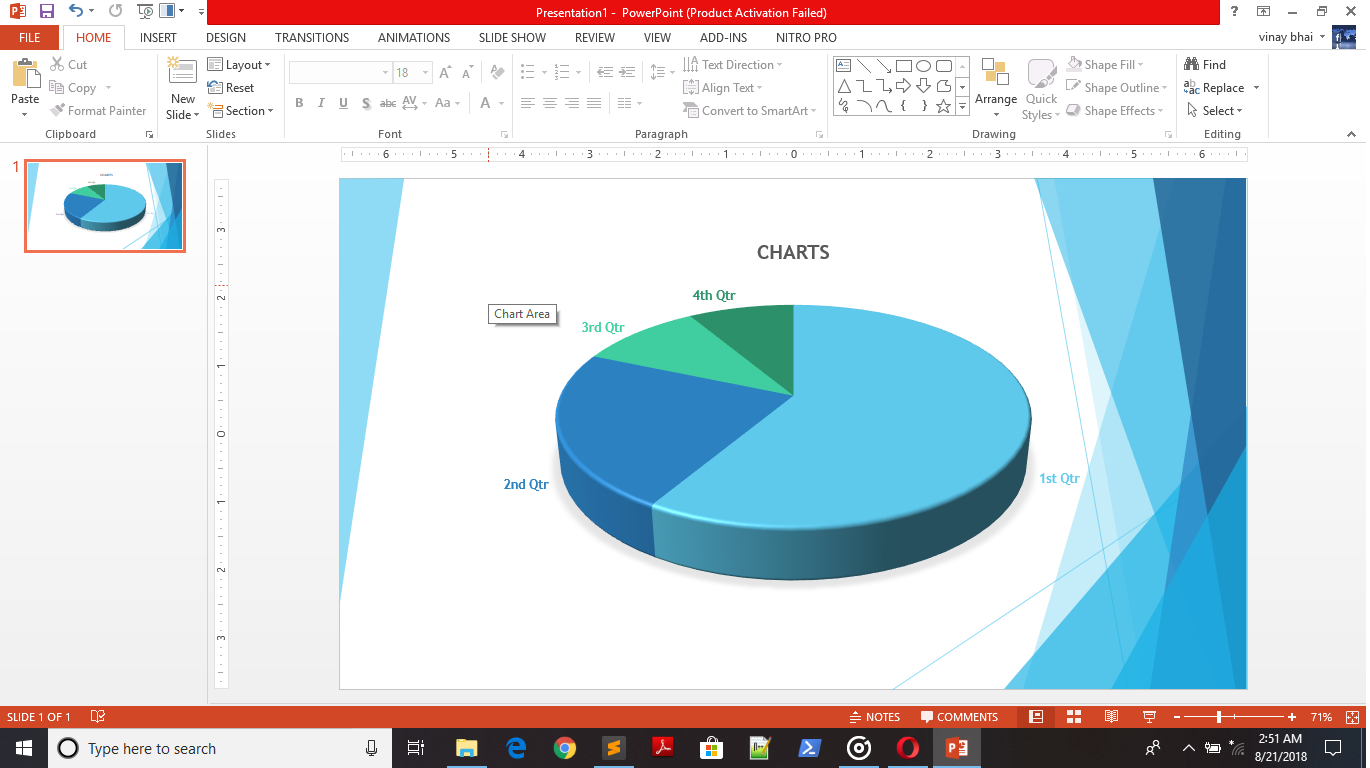
Charts –
Presentation allows to use charts in your slides and with the help of chart you can shows the data in more relevant way. Charts are used to show graphs in a reports. There are many types of charts in a PowerPoint to express you data more effectively. In the below section you can see a types of charts in PowerPoint.
Inserting a Charts –
Perform the following steps to insert a charts in slides –
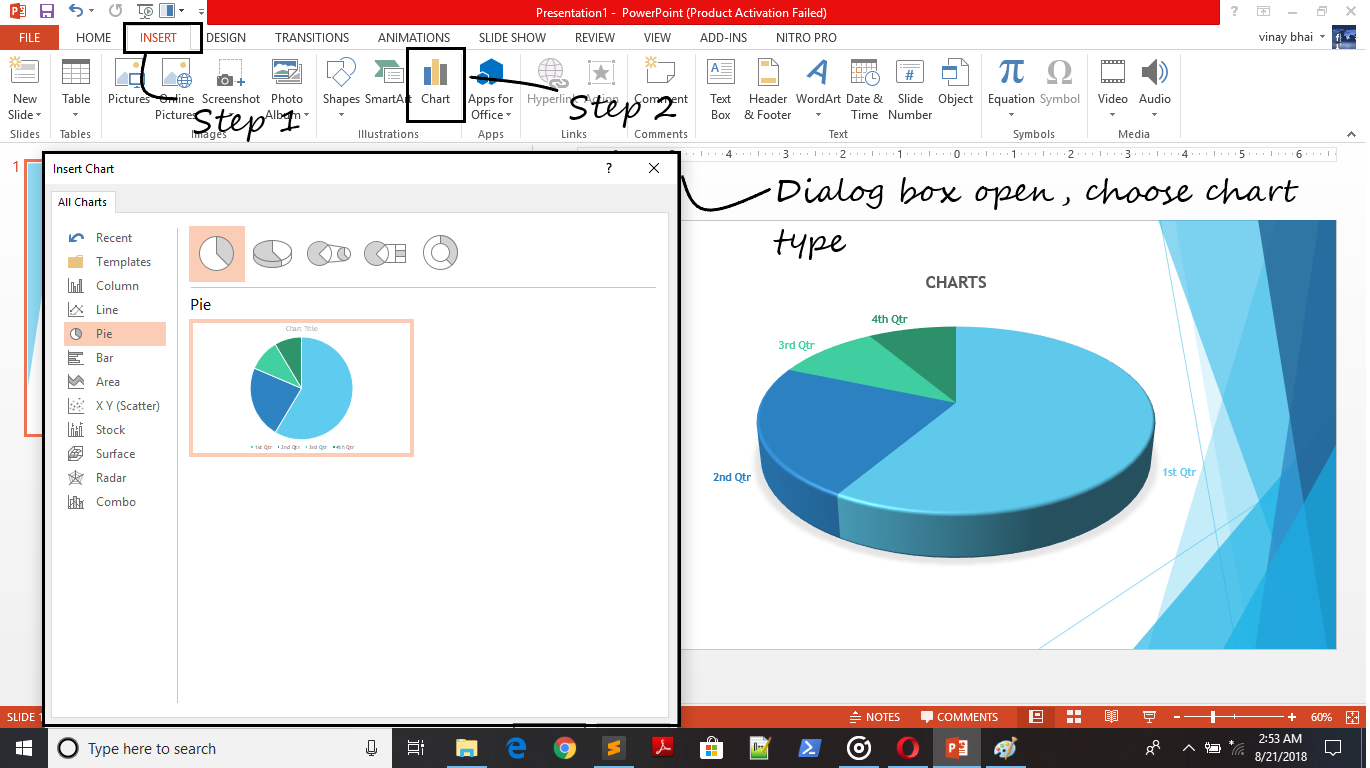
- Select the slide in which you need to insert the charts.
- Select a Chart command inside an Illustration section under Insert tab.
- A new dialog box will open with a many charts category, select any one relevant to data and select it.
- A selected chart will get appear in slides.
- A spread sheet also appear, with some dummy text.
- Replace these text with your information which is going to see in a graph.
- Once you enter the data relevant to chart, click on close to close the dialog box.
- The chart with relevant data will appear.
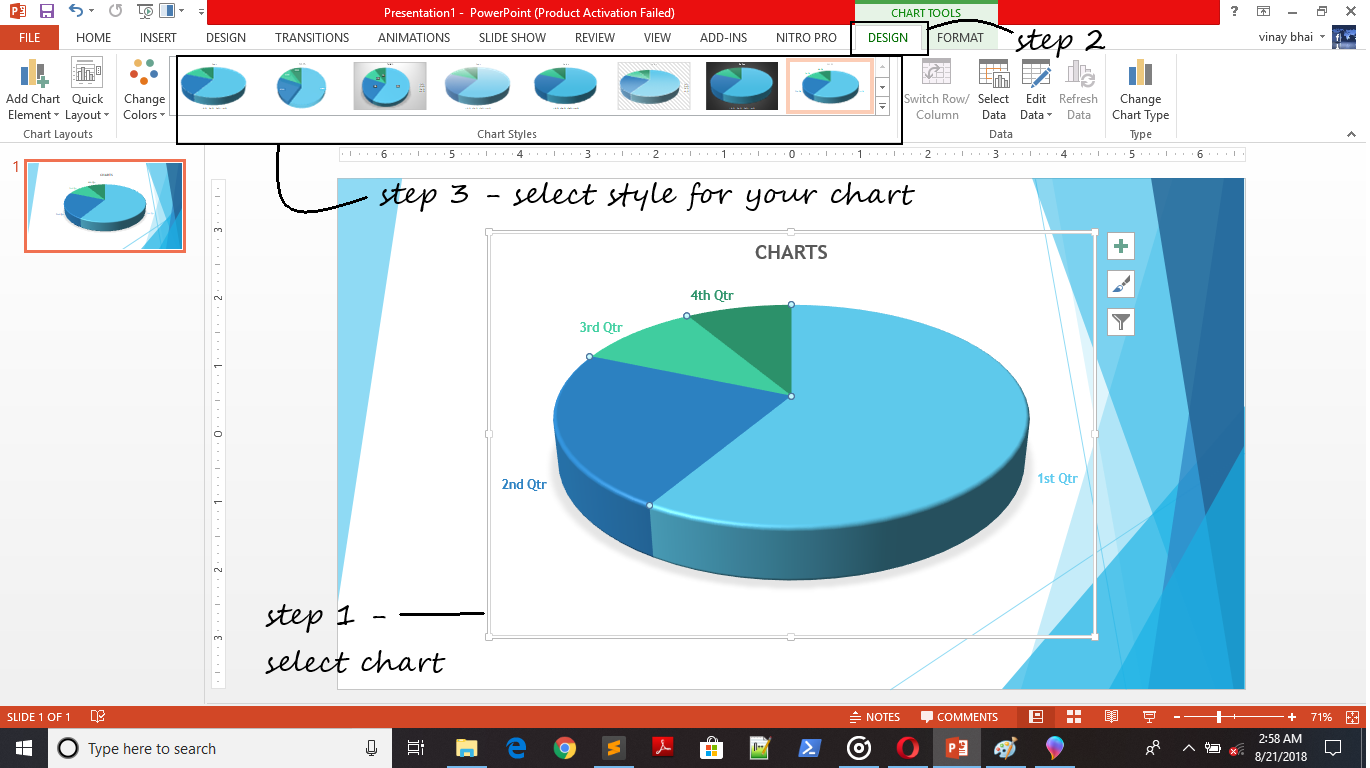
You can edit your data anytime, just by clicking on chart and to select the Edit data command under Data section inside a Design tab.
To change or customize a chart style you can simply choose any style of your choice from Chart Style section under Design tab.
You can change or customize the chart color, chart layout, chart type etc. just by clicking on command under Design tab to give a better appearance to your presentation.
Also, if you want to share your knowledge and experience with others then send us your presentation with hashtag #ShareYourKnowledge. If your presentation is really good, we share it on our website with your name and details.
Because we not only want to learn new skills, we want to share our skills also. #ShareYourKnowledge
Share Your Knowledge
A Campaign to Learn
If you know something well enough, share it with others.Mail us your own written article and we share it with other students, on our portal with your name !!
Read MoreIs this helpful ?
Give us your feedback, review or rate us so, we can improve ourself in order to gives you Best !!